Previous Story
Useful Information During a Rezoning Debate
 Anytime the word “rezoning” is mentioned, folks begin to dig in their heels to stay where they are. And when rezoning is discussed without factual information about enrollment, building capacity, and achievement (a.k.a. test scores) accompanying the rationale for rezoning, misinformation usually fills the void.
Hoover City Schools Superintendent Andy Craig has been floating a rezoning proposal over the summer to various selected parent groups. The larger community is now getting wind of that proposal, and the various neighborhoods that could be affected by this rezoning are getting organized.
Part of getting organized is getting that information. Because Hoover is my hometown, I have been gathering data for many years. Every time I hear of a superintendent or board of education springing a proposal (of any kind) upon a community, I am struck by the lack of information provided alongside the proposal.
And while Craig has promised the community will have an opportunity for input, empowering parents and communities to provide that input and engage in decision-making means providing to them the same information school officials have.
Enrollment information is only one piece of many that the Superintendent is considering, but it is the primary driver, according to Craig.
So here is Hoover’s elementary school enrollment data by year, from the 1995-1996 school year through the 2013-2014 school year. It is broken down by descriptors of race and ethnicity. There are multiple ways to view the data.
I share this here to allow you to see what COULD be produced for communities to allow us to better engage in a rezoning discussion, to allow us all to get to know ourselves better, to allow us to poke around and play with the data to see what we have looked like over time. Where the pressure points are. Which schools are growing. Which schools are shrinking.
Yes, we need maps. We need to know how many children are attending private school. We need models of “if we move this neighborhood here, then the population increases/decreases by this much at the school”.
It is no longer enough for superintendents and boards to say to a community “this is what we’re gonna do” without showing their work.
What other information do you believe would be helpful to help communities understand the need for rezoning?
UPDATE: A helpful reader let me know that numbers for the Asian and Hispanic children were missing for a few elementary schools for 2013-2014. Sure enough, the data wasn’t there. These numbers were updated at 11:10 p.m., August 8, 2014, to reflect the inclusion of those numbers. My apology for the error.
UPDATE #2: Another helpful reader let me know that the Multi-race numbers were missing for a few elementary schools. Yep. She was right. These numbers were updated at 10:00 a.m. on August 9, 2014. The Multi-race designation was not added until the 2011-2012 school year.
Also, while it is mentioned in the tables below, please note that any subgroup that has fewer than 10 students that are male or 10 students that are female in that subgroup will not have a number reported for that subgroup in accordance with FERPA regulations. So the individual subgroups could possibly be off by as much as 18 students if there are 9 male and 9 female students in that subgroup because the ALSDE reports those numbers by gender.
Sincere appreciation to the helpful readers who are pointing out missing data. Keep letting me know if something looks strange with the data.
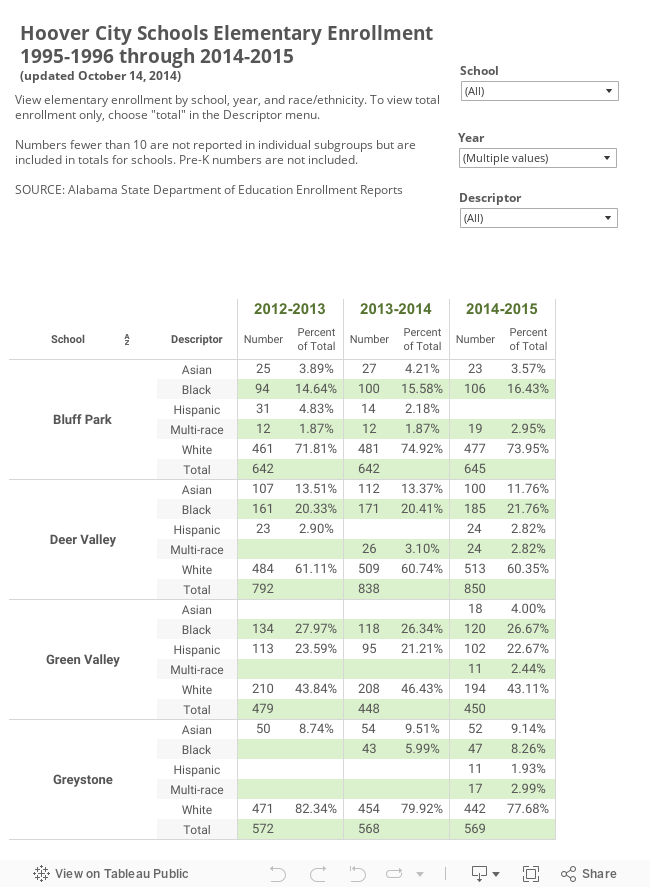
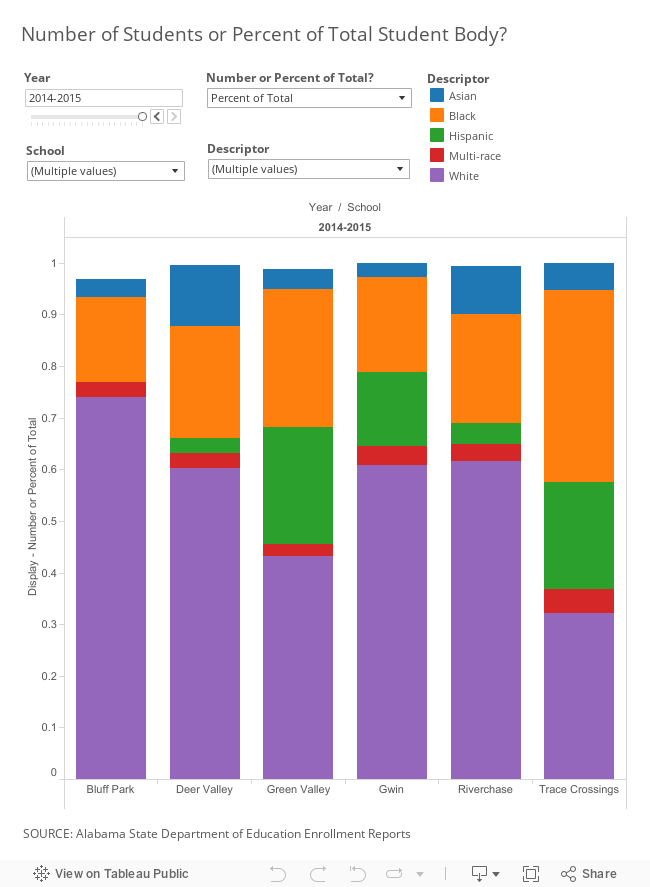
SOURCE: Alabama State Department of Education Enrollment Reports