Previous Story
MAP: The “Failing” Public Schools & the AAA-Participating Schools
Posted On Feb 25 2016
Comment: 0
 According to Alabama’s lawmakers, they created the Alabama Accountability Act (AAA) to allow parents to choose better educational options for their children.
Getting a look at what choices there are, looking at where the non-public schools participating in the AAA’s tax-credit scholarship program are located, juxtaposing them with the location of the latest list of “failing” public schools shows clearly where students actually do have choices, and where they don’t.
Challen Stephens of al.com recently wrote an analysis pointing out the common trait among Alabama’s “failing” schools: they are filled with African-American students.
Another trait they share: those schools are filled with students in poverty.
More than 95% of students in 68 of the 76 schools on the 2016 “failing” schools list are eligible for free or reduced-price meals. In 64 of those schools, 100% of students are eligible.
Here’s a general update on who is using the tax-credit scholarship program under the AAA, though we still don’t have any test results or other accountability measures for results for students using tax-credit scholarships.
The changes passed by lawmakers in 2015 created a more specific plan for measures of accountability than the original act, but those results won’t be available until September 1.
Tax Credit Scholarships as of December 31, 2015
Thanks to those 2015 changes, we know more about the students receiving tax-credit scholarships and which schools they attend.
Quarterly reports are now required, and the reports filed for the quarter ending December 31, 2015, show the following:
- 3,697 students were reported to be using tax-credit scholarships from Alabama’s scholarship granting organizations (SGOs) to attend participating schools,
- 871 of those students were zoned to attend a public school labeled “failing” in 2015,
- 153 were first-time scholarship recipients that were enrolled in a private school during the 2014-2015 school year,
- 329 were first-time scholarship recipients that were enrolled in a public school during the 2014-2015 school year,
- 149 of the 182 participating non-public schools enrolled students using tax-credit scholarships.
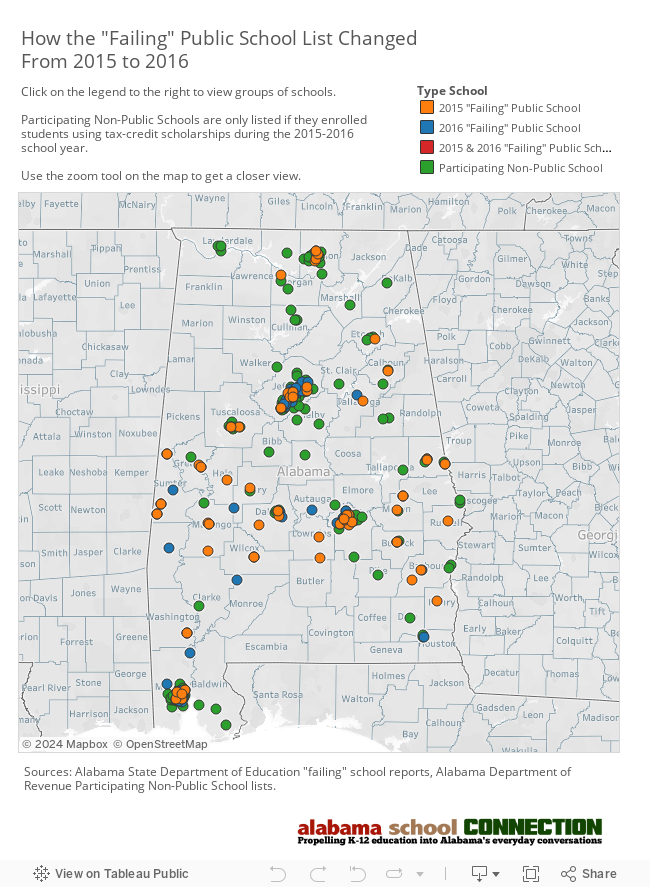
How the “Failing” Public School List Changed from 2015 to 2016
Part of the 2015 changes included a change in the way “failing” schools are defined. Now, schools are labeled “failing” if their combined test results from the previous spring’s standardized testing place them in the bottom 6% of schools statewide.
Prior to this year, a school had to land in the bottom 6% in three of the last six years. Many said that measure unfairly labeled schools who were showing improvement but were stuck on the list until the six-year time frame was exhausted.
It’s important to understand that if you’re forced to label the bottom 6% as failing, there will always be somewhere around 75 to 80 schools in that category, depending upon how many schools are in existence in Alabama. And regardless of what type of improvement a school has made from one year to the next.
And, as Stephens pointed out, schools that are able to hide achievement gaps among various identified subgroups will evade the label even if they’re failing large groups of children within the school.
[Read this to catch up on the basics of the AAA, including which students are eligible.]
The way “failing” public schools are determined will change again when Alabama begins using the A-F grading system for schools. More on that another day.
The Maps
After the first round of quarterly reports were filed last October, we showed you where the “failing” schools and where the participating non-public schools were located.
The map below has been updated to show where the 76 schools declared “failing” based on 2014-2015 test results are located.
The map shows the location of the newly-labeled “failing” public schools in red, and the schools enrolling students using tax-credit scholarships in green.
If you click on the legend within the map, you can view each group of schools. Click it again to bring all schools back into view. Hover over a marker to learn more details about the school.

Here’s a look at just the schools themselves…how the list changed from 2015 to 2016, which schools are on the list for both years in spite of the change in methodology, and where the participating non-public schools enrolling students using tax-credit scholarships are located.
How Measuring Students in Poverty Has Changed and Why It Matters
The percentage of students eligible for free or reduced-price meals is accepted as a measure of the percentage of students in poverty within a school.
Due to a change in how poverty status is gathered and reported, the information that is readily available no longer captures the free and reduced-price meal eligibility of students in Alabama’s schools.
This is a really big deal on the national level, and one that researchers are currently struggling with while acknowledging that a child’s eligibility for free or reduced-price meals doesn’t necessarily correlate with the level of poverty in the child’s family.
Beginning with the 2014-2015 school year, school districts can use “direct certification”, an electronic data identification mechanism, to determine whether students’ families are receiving any type of government assistance, including Temporary Assistance for Needy Families (TANF) or Supplemental Nutrition Assistance Program (SNAP).
Schools with more than 40% of students eligible for those programs can choose to offer free meals, including lunch and breakfast, school-wide to all students, regardless of poverty status by participating in the Community Eligibility Provision (CEP) program.
The U.S. Department of Agriculture (USDA) administers the CEP as part of the National School Lunch Program.
Of the 787 schools eligible in Alabama, only 387 chose to participate during the 2015-2016 school year according to data from the Alabama State Department of Education.
If schools choose to participate, families are not required to complete the application for free and reduced-price meals.
That leaves the percentage of students truly eligible for free or reduced-price meals as an unknown. It can be approximated by using the calculation accepted by the USDA for schools participating in the CEP.
In the maps above, the new method of calculating the percentage of students eligible for free or reduced-price meals is used.
More on CEP another time.